
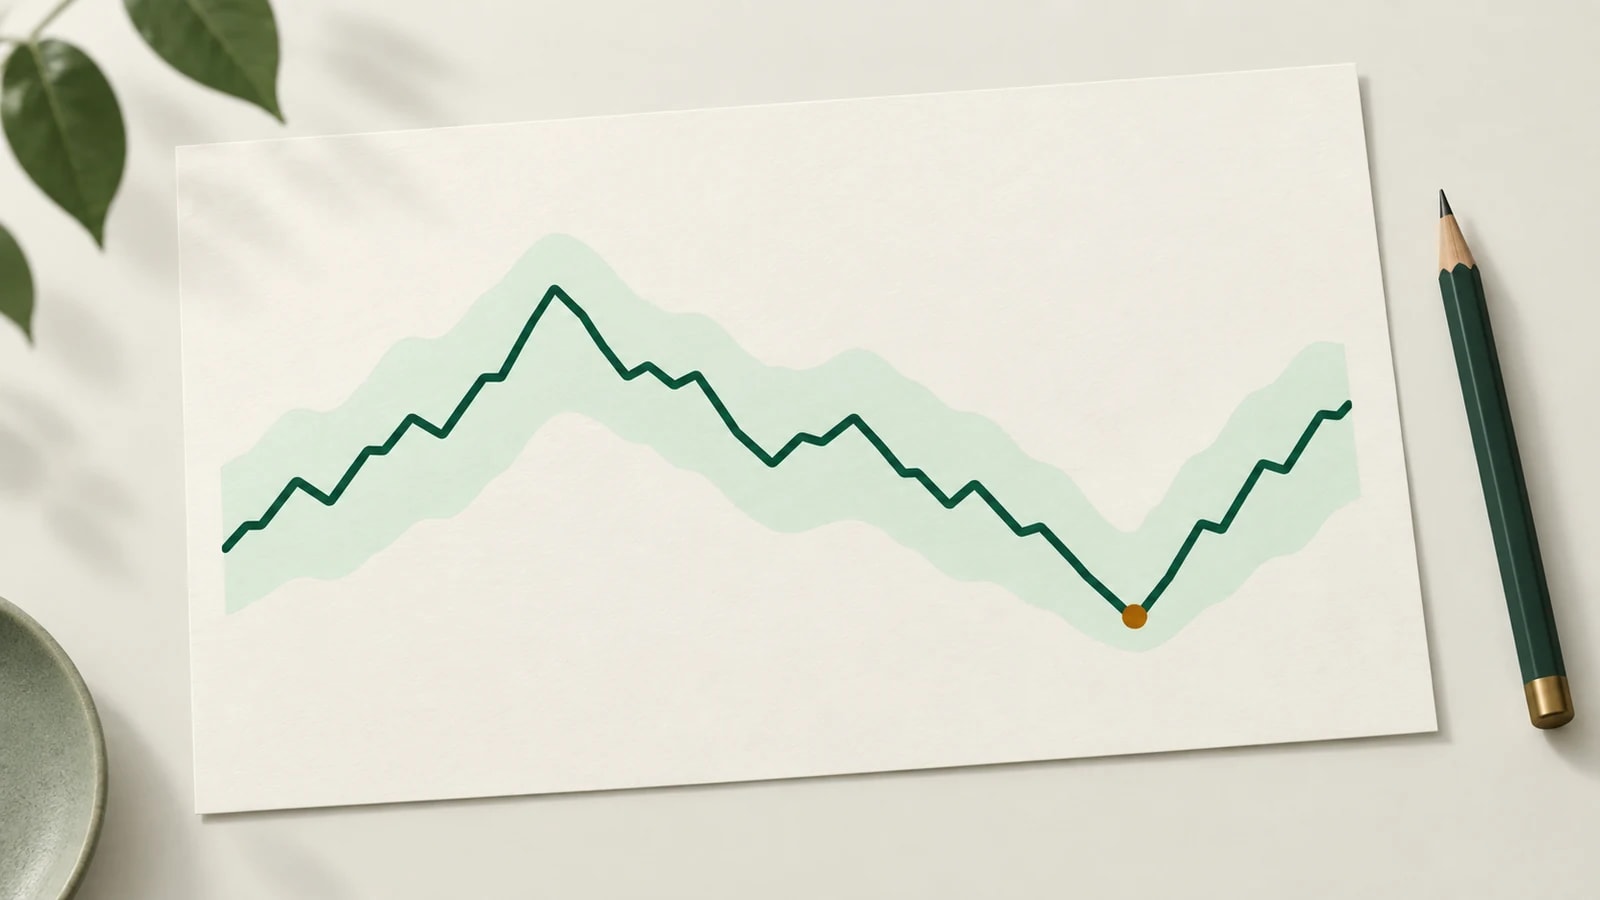
A price history chart looks technical, but it answers one plain question: is today's price good, or just normal? Once you know where to look, reading one takes less than a minute.
The examples below use SpendMitra's charts, but the same ideas work on any price tracker. Where it helps, we have added what we learned from a year of prices on 1,500 Amazon and Flipkart products.
Start with the range
First, notice how far the price moves. Look at the highest and the lowest points over the last three months.
Prices on Amazon and Flipkart move more than most people expect. In our sample, the typical gap between a product's highest and lowest price in a year was 38%, and for one product in four it was more than half. Something that peaks at ₹2,000 might well dip to around ₹1,250 at its lowest.
Find the usual price
Next, find where the line spends most of its time. That is the usual price, and it matters more than the MRP or any badge. Our charts show it as the average for the period you pick.
If today's price is at or above the usual price, it is a normal day, whatever the discount badge says.
Check how low it goes, and for how long
The lowest point on the chart is the price to aim for. But look at its shape too:
- A thin spike down means the low lasted a day or two.
- A flat stretch at the bottom means the price stayed there for a while.
- Several dips to the same level mean the product keeps coming back to that price.
How long a low price lasts
The typical product stayed at its lowest price of the year for about two and a half days.
That short window is why checking a product once a week often misses the best price. It is also why alerts are so useful: they watch every change for you.
Look at the rhythm
Prices don't only change during big sales. The typical product in our sample changed price three or four times a month. Flipkart listings moved more often than Amazon ones, around six times a month against three.
Some products drop on a regular cycle. Others stay flat for months and then fall sharply during a sale. The chart tells you which kind you are looking at, and so how long a wait might be.
Put it together
Now place today's price against what you have seen:
Good time to buy
- Today's price is near the recent low
- Lows on this product are short and rare
- You need it soon
Worth waiting
- Today's price is at or above the usual price
- The chart shows regular dips
- A big sale is a few weeks away
On SpendMitra, this is summed up in the verdict at the top of each product page. It looks at where today's price sits in the product's history, how far it is below the usual price, which way the price has been moving and how well the product is rated, and turns that into one of four words: buy now, good price, fair price or wait.
When the price isn't right yet
If the chart says wait, set a price drop alert. Pick a target close to the recent low rather than the all-time low from a one-day spike, and we will tell you on Telegram, by email or in the app when the price gets there.
You can open the chart for any product by pasting its link on our Amazon price history or Flipkart price history pages.
How we measured this
The figures come from 1,500 products picked at random from the 31,637 we track, each with at least six months of price history and most with a full year. "Typical" means the median product. All numbers are rounded.